Appearance
Experience Metrics
Experience-level metrics show how a single mem-re Experience is performing. View them from an experience's Overview page or Insights to see scans, activations, and Action Tile engagement for that Experience.
Available Metrics
| Metric | Description |
|---|---|
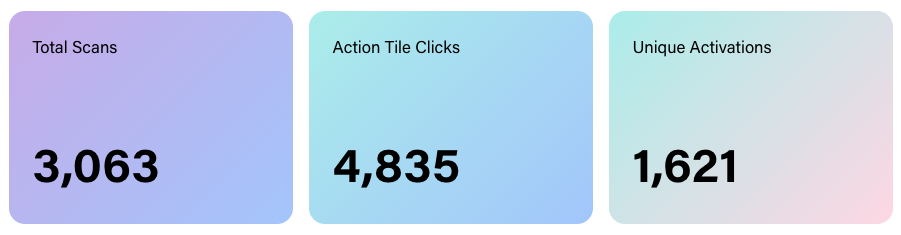
| Total Scans | The total number of times this mem-re Experience has been activated by either a QR scan or a card tap. This includes repeat scans by the same person. |
| Action Tile Clicks | The total number of clicks on Action Tiles on this individual mem-re Experience. |
| Unique Activations | The number of individual mem-re items from this Experience that have been activated at least once. |
Graphs
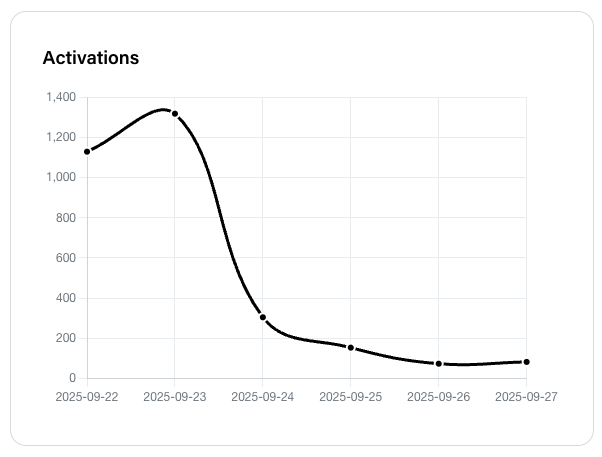
Activations Over Time
A line graph showing how engagement is trending for that individual mem-re Experience based on the date range set.
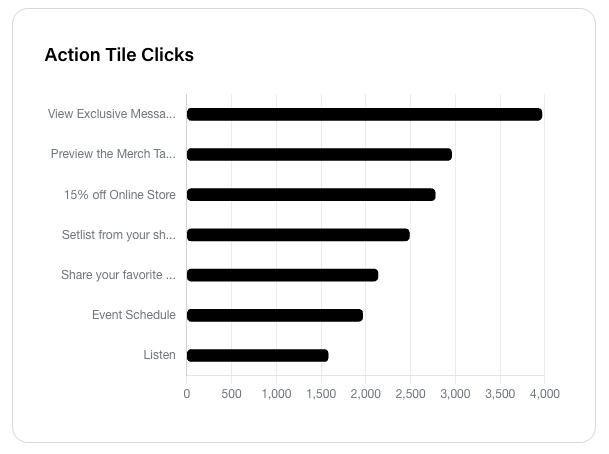
Action Tile Clicks Breakdown
The Action Tile Clicks graph pulls the names of the Action Tiles on that individual Experience and shows engagement from the most clicks to the least, based on the date range set. Use it to see the Action Tiles that are driving the most engagement on that Experience.