Appearance
Home Dashboard
The Home page is the first thing you see when you log in. It shows aggregate metrics across all of your Experiences, giving you a high-level view of how your mem-re Experiences are performing.
Available Metrics
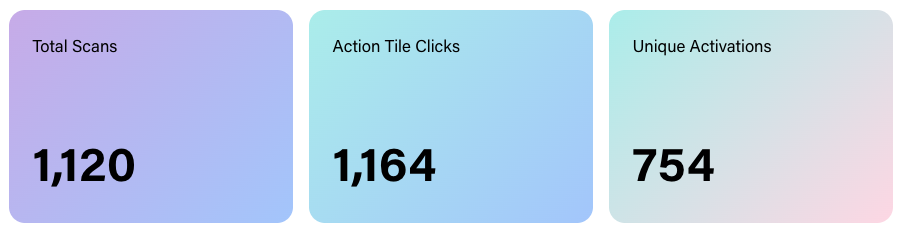
These are the top-level metrics tracked across all of your mem-re Experiences.
| Metric | Description |
|---|---|
| Total Scans | The total number of times a mem-re product has been activated by either a QR scan or a card tap. This includes repeat scans of the same item. |
| Action Tile Clicks | The total number of clicks on Action Tiles across all mem-re Experiences. |
| Unique Activations | The number of individual mem-re items that have been activated at least once. |
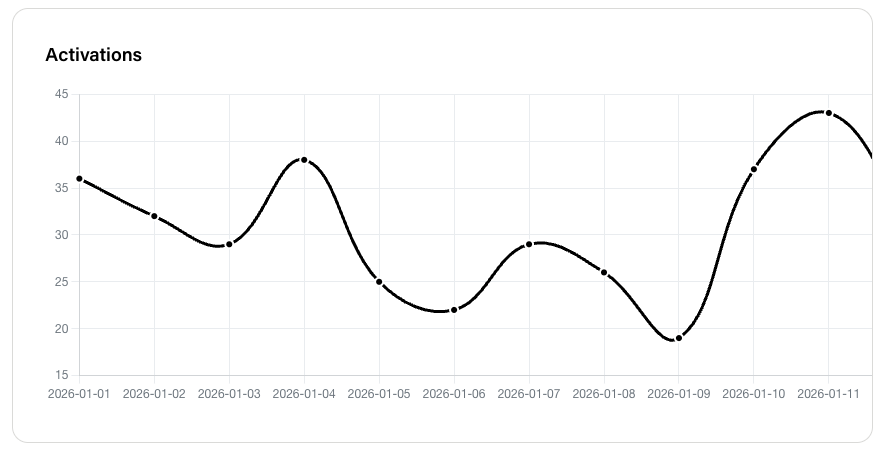
Activations Over Time
A line graph showing how engagement is trending across all of your mem-re Experiences based on the date range set.
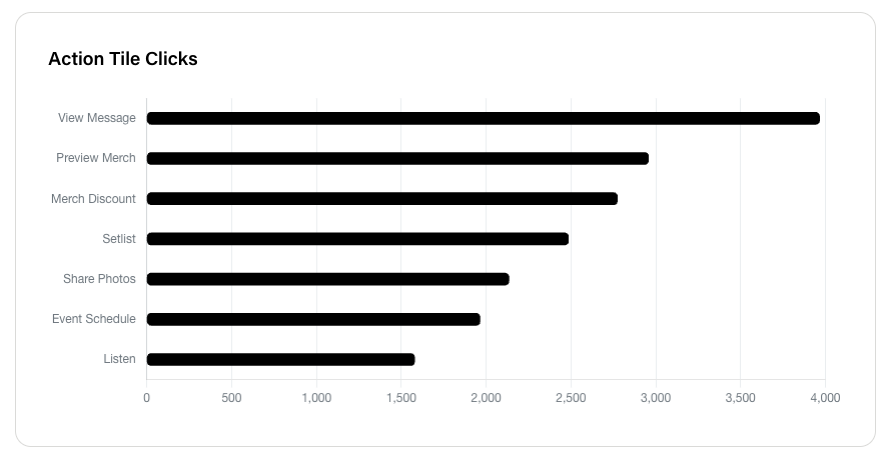
Action Tile Clicks Breakdown
The Action Tile Clicks graph pulls the Categories from all Action Tiles on each Experience and shows engagement broken down by Action Tile Category. Use it to see the types of Action Tiles that are driving the most engagement across your Experiences.
Date Range Filtering
Select a start and end date to narrow the data to a specific time period. This is useful for:
- Measuring performance of Experiences during a specific span of time.
- Comparing engagement across different time periods.
- Identifying trends across your entire catalog of Experiences.